import intake
import hvplot.pandas
import hvplot.xarray
import cook_inlet_catalogs as cic
import holoviews as hv
HF Radar (UAF)
HF Radar from UAF.
Files are:
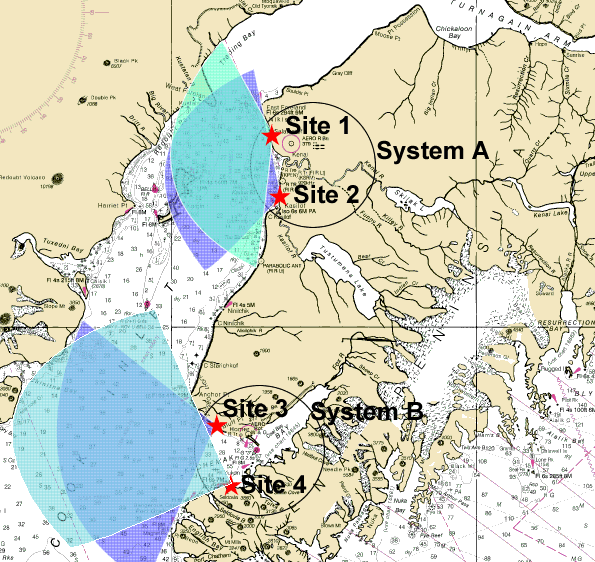
Upper Cook Inlet (System A): 2002-2003 and 2009
Lower Cook Inlet (System B): 2006-2007
Data variables available include tidally filtered and weekly averaged along with tidal constituents calculated from hourly data.
Several new datasets were derived in 2024 with the CIOFS freshwater project which narrow the full time datasets (lower-ci_system-B_2006-2007.nc and upper-ci_system-A_2002-2003.nc) in time to just 2003 and 2006, respectively, before running processing in Research Workspace and are otherwise identical. See processing notebook https://researchworkspace.com/file/44879475/add_variables_to_notebooks_limited_time_range.ipynb:
lower-ci_system-B_2006_subtidal_daily_mean.nc
lower-ci_system-B_2006_tidecons_base.nc
lower-ci_system-B_2006_subtidal_weekly_mean.nc
upper-ci_system-A_2003_subtidal_daily_mean
upper-ci_system-A_2003_tidecons_base
upper-ci_system-A_2003_subtidal_weekly_mean.nc
Some of the data is written up in reports:
cat = intake.open_catalog(cic.utils.cat_path("hfradar"))
Plot all datasets in catalog
dd, ddlabels = cic.utils.combine_datasets_for_map(cat)
dd.hvplot(**cat.metadata["map"]) * ddlabels.hvplot(**cat.metadata["maplabels"])
List available datasets in the catalog
dataset_ids = list(cat)
dataset_ids
['lower-ci_system-B_2006-2007',
 'lower-ci_system-B_2006-2007_subtidal_weekly_mean',
 'lower-ci_system-B_2006-2007_tidecons',
 'lower-ci_system-B_2006_subtidal_daily_mean',
 'lower-ci_system-B_2006_subtidal_weekly_mean',
 'lower-ci_system-B_2006_tidecons',
 'upper-ci_system-A_2002-2003',
 'upper-ci_system-A_2002-2003_subtidal_weekly_mean',
 'upper-ci_system-A_2002-2003_tidecons',
 'upper-ci_system-A_2003_subtidal_daily_mean',
 'upper-ci_system-A_2003_subtidal_weekly_mean',
 'upper-ci_system-A_2003_tidecons',
 'upper-ci_system-A_2009',
 'upper-ci_system-A_2009_subtidal_weekly_mean',
 'upper-ci_system-A_2009_tidecons']
Select one dataset to investigate
try:
    dataset_id = dataset_ids[2]
except:
    dataset_id = dataset_ids[0]
print(dataset_id)

dd = cat[dataset_id].read()
dd
lower-ci_system-B_2006-2007_tidecons
<xarray.Dataset> Size: 248kB
Dimensions:      (x: 26, y: 35, ntidecons: 8, tideconvals: 4)
Coordinates:
  * x            (x) int64 208B 0 1 2 3 4 5 6 7 8 ... 17 18 19 20 21 22 23 24 25
  * y            (y) int64 280B 0 1 2 3 4 5 6 7 8 ... 26 27 28 29 30 31 32 33 34
  * ntidecons    (ntidecons) <U2 64B 'M2' 'S2' 'K2' 'K1' 'N2' 'P1' 'O1' 'Q1'
  * tideconvals  (tideconvals) <U11 176B 'major' 'minor' 'inclination' 'phase'
    lat          (x, y) float64 7kB dask.array<chunksize=(26, 35), meta=np.ndarray>
    z            float64 8B ...
    lon          (x, y) float64 7kB dask.array<chunksize=(26, 35), meta=np.ndarray>
Data variables:
tidecons (x, y, ntidecons, tideconvals) float64 233kB dask.array<chunksize=(26, 35, 8, 4), meta=np.ndarray>Plot one dataset
keys = list(cat[dataset_id].metadata["plots"].keys())
print(keys)

plots = []
for key in keys:
    plot_kwargs = cat[dataset_id].metadata["plots"][key]
    if "clim" in plot_kwargs and isinstance(plot_kwargs["clim"], list):
        plot_kwargs["clim"] = tuple(plot_kwargs["clim"])
    if "dynamic" in plot_kwargs:
        plot_kwargs["dynamic"] = False
    plots.append(cat[dataset_id].ToHvPlot(**plot_kwargs).read())
hv.Layout(plots).cols(1)
['tidecons']